This isn’t an anti-proprietary rant. I still reach for frontier models daily. But for a growing share of my work I want to own the stack — run the weights on hardware I control, know exactly what I’m giving up, and pay in electricity instead of per-token. The moment you take that seriously, “just use an open model” turns into three uncomfortable questions:
- Can I actually run it — on the hardware I have, at a speed I can live with?
- Can I trust the quantized version I’ll realistically deploy?
- Can I measure it against a frontier model on work I care about, with an eval I believe?
So I picked one model — LiquidAI’s LFM2.5-8B-A1B, a small mixture-of-experts — and spent about four weeks, two hours a day, five days a week, torturing it. The pace was slow on purpose. Every benchmark number threw up a “wait, why?”, and answering it honestly meant re-deriving roofline limits, memory math, and MoE routing by hand instead of nodding along. What follows is the notebook, in order.
Most findings follow the same loop: the raw numbers, my read (the reasoning I brought from what I understood of the hardware), the correction when I pushed on it, and a self-grade out of 10. Some questions I still can’t answer — those are marked, and I’d genuinely like your help.
The model on the bench
LFM2.5-8B-A1B is a mixture-of-experts model: 8.47 B total parameters, but only ~1 B active per token. Each MoE layer has 32 experts and routes every token through just 4 of them; the earliest layers are dense. That “A1B” — active 1B — is the whole reason a model this capable fits on modest hardware, and it’s also the source of half the weird behavior below.
One MoE layer. Attention and the router stay on the GPU; the expert FFNs are what -ncmoe can push across to system RAM. Hold onto this picture — it explains the offload sweet spot, the Flash-Attention no-op, and the thread-count flatline further down.
| Quant | Size on disk | Bits/weight |
|---|---|---|
| BF16 | 15.78 GiB | 16.0 |
| Q6_K | 7.20 GiB | ~6.6 |
| Q4_K_M | 4.95 GiB | ~4.8 |
| Q3_K_M | 3.66 GiB | ~3.9 |
| IQ3_XS | 3.30 GiB | ~3.3 |
| Q2_K | 2.72 GiB | ~2.6 |
Remember these sizes. On a 16 GiB card, BF16 (15.78 GiB) technically “fits” — with almost nothing left for the KV cache or compute buffers. That razor-thin headroom is a character in this story.
llama.cpp, and two rules I kept close
Everything here runs on llama.cpp (build b9585). Three binaries did the work: llama-bench for throughput sweeps, llama-cli for quick runs, llama-perplexity for quality. Throughput splits into prefill (pp, ingesting the prompt) and decode (tg, generating), and they behave like different animals: prefill is compute-bound, decode is memory-bandwidth-bound. Half of what follows is just internalizing that one sentence.
The validity rule. llama-cli's "prompt t/s" is measured over a ~7-token prompt — fixed overhead, not real prefill. Only llama-bench pp/tg numbers are trustworthy.
The noise rule. With ±20–90% standard deviation on many rows, don't explain a gap smaller than its own error bar.
Phase 1 — MacBook M2 Air (8 GB unified)
The project began as a humbling exercise. On an 8 GB M2 Air, BF16 was a fantasy and even Q6_K wouldn’t load — the Metal working set caps out around 5.6 GB. That forced me down to Q4_K_M and IQ3_XS, and forced me to understand why. Unified memory means CPU and GPU share one ~100 GB/s pool with no PCIe between them — a fact that quietly invalidates a lot of desktop-GPU intuition. The chain of runs, in order:
GPU+FA prefill 34–42 · GPU decode ~17 · CPU (-ngl 0) decode ~34
FlashAttention raises prefill a lot — online softmax by tiling, computed on the fly in cache during the forward pass, never written back to GPU RAM, easing HBM traffic. But decode barely moves — why? Drop to CPU and decode nearly doubles while prefill craters: that fits a memory-bound ceiling — ~100 GB/s over ~2–3 GB of active params + KV + activations ≈ 40 t/s, and the numbers lined up. So why is GPU decode ~2× lower? Probably too little headroom — only ~5.6 GB available. And 4 threads beat 3, but pinning all 4 cores risks throttling, so I'd call 3 optimal.
Two catches. The cli "prompt t/s" is a ~7-token measurement — overhead, not prefill, so trust llama-bench. And the low GPU decode is working-set pressure at the 5.6 GB ceiling, not a bandwidth deficit — the bus is shared, so the CPU doesn't have more bandwidth.
The cli numbers were too clean to trust. Was I even measuring prefill? → move to llama-bench.
pp256 fa1 272 · fa0 229 · tg128 ~22–24 (flat)
The bench prefill (229–272) is far higher than the cli figure — this is the number that makes the model look genuinely useful for agentic work that ingests a lot of context.
Right to trust bench over cli. But the 10× gap vs a CPU run is GPU-vs-CPU (bench defaults to -ngl 99), not FA — within this GPU sweep FA is only ~19%.
If bench prefill is real and this high, does it survive more context? → KV-depth sweep.
pp512 47→36 · tg128 23→13 as depth 256→4096
As context shrinks, both prefill and decode rise; 1024–2048 looked like the sweet spot.
Correct, and for the right reason — deeper KV means more compute for prefill and a bigger cache to read each decode step; decode is the more bandwidth-sensitive, so it falls hardest (23→13).
Decode looked thread-sensitive — how far do cores take it? → thread sweep.
pp1024 21→48 (1→4 threads) · tg128 peaks ~21 at t=3, then dips
Prefill keeps climbing with threads, but decode maxes out at 3 and then falls — decode is memory-bound, so pinning all 4 cores stresses compute and queues background processes, dropping tps.
Prefill is compute-bound → scales with cores; decode is bandwidth-bound → saturates around 2–3, and the 4th thread just adds contention. Fair — though the t=4 dip (±9.2) is inside the noise, so "stops improving past 3" is the safe claim.
Threads capped decode; could a bigger micro-batch push prefill instead? → ubatch.
pp1024 ~46 / 43 / 46 (flat) · tg128 drifts 14→18
ubatch gave only a marginal decode bump — but ubatch should help compute (prefill), not decode. Needs clarification.
ubatch is a prefill-only knob (prompt tokens per micro-batch) — it can't touch one-token-at-a-time decode, so that drift is noise; the instinct to retry was right. Prefill was flat because at pp1024 on CPU there's little batching headroom left.
ubatch barely moved the needle — maybe fit, not flags, is the lever. → try the smaller IQ3 build fully on GPU.
pp512 307–314 · tg128 ~23 · FA ≈ flat
The importance-weighted IQ3 quant has marginally higher prefill than Q4_K_M and, at 3.3 GiB, loads fully into the GPU.
Right. On this M2 the edge is fit + fewer weight-bytes, not raw compute — there are no low-precision matmul units, so quant actually adds a little dequant work. FA is flat here because at short context attention isn't the bottleneck.
IQ3 fits with headroom. What if I deliberately shove experts onto the CPU? → ncmoe.
pp512 314→234 · tg128 23→10 as 0→32 experts offloaded
Since it's unified memory, moving MoE experts to the CPU shouldn't matter for prefill — yet it keeps dropping, and the fall is even worse than running everything on CPU. I think tokens have to keep switching between attention on the GPU and experts on the CPU, and that transfer is slow.
The conclusion (CPU compute is the bottleneck) is right, but there's no transfer here — unified memory, one pool, no PCIe, no copy. The cost is that offloaded layers run on slow CPU matmul plus a Metal↔CPU re-sync every layer. Offload only pays when the model doesn't fit — and IQ3 already does.
Offload backfired with nothing to relieve. To actually see it help, I needed real VRAM pressure and a real bus. → the RTX 5060 Ti.
The verdict for the M2 Air: prefill-strong, decode-modest — useful for context-heavy ingestion, less so for long generation. Two structural facts explain most of the runs above: on unified memory capacity (how much fits in the ~5.6 GB working set) is the constraint, not the shared bandwidth; and the honest prefill numbers come from llama-bench.
Phase 2 — RTX 5060 Ti (16 GB, Blackwell)
Then I moved everything to a real GPU: an RTX 5060 Ti, 16 GiB VRAM, 64 GB of system RAM. Now BF16 fits (barely), -ncmoe has a real PCIe bus to cross, and offload finally has something to relieve. The full run sequence:
| KV depth | prefill t/s | decode t/s |
|---|---|---|
| 256 | 1157.18 | 21.62 |
| 512 | 1133.59 | 21.47 |
| 1024 | 4355.00 | 41.87 |
| 2048 | 4074.68 | 38.12 |
| 4096 | 4025.14 | 38.08 |
| 8192 | 3181.25 | 34.90 |
| 20000 | 2606.40 | 32.94 |
At 256–512 tokens maybe not all CUDA cores are used in the tiling-based matmul (this isn't FA). By 1024–4096 the GPU is fully utilised while the KV cache and activations still fit in VRAM. Past that, the growing context forces some weights/activations out to CPU RAM, slowing things down.
The decay half is right — KV growth eventually spills to the host. But "cores idle below 1024" is weak: 512-token prefill is already highly parallel. That clean 3.75× step at exactly d1024 looks like a kernel-path or allocation threshold — and I still can't prove it (open question below).
That d1024 jump nagged, but first: with headroom this tight, what frees it? → ncmoe sweep.
| -ncmoe | prefill t/s | decode t/s |
|---|---|---|
| 0 | 1217.72 | 22.02 |
| 2 | 1217.52 | 22.05 |
| 4 | 3068.92 | 78.28 |
| 6 | 2159.20 | 64.51 |
| 8 | 1671.78 | 55.06 |
| 16 | 957.24 | 34.15 |
| 32 | 650.62 | 22.99 |
32 experts, 4 active, first couple of layers likely dense. With the weights nearly filling VRAM there's almost no headroom. Offloading some experts to CPU RAM over PCIe relieves that and frees the GPU for compute, so both prefill and decode jump — up to ncmoe=4. Beyond 4, the post-attention activations travel to CPU RAM over the slow PCIe, through experts on the even-slower CPU, and back; that traffic overwhelms the gain.
The shape confirms it. ncmoe 0 and 2 are identical because 2 experts don't free enough; 4 crosses the capacity threshold that lets the KV cache and compute buffers stay resident (+152% prefill, +256% decode). It's a threshold, not a gradient.
ncmoe=4 was magic at 20k depth. Does it survive far longer context? → push depth to 100k.
pp1000 2827 → 1107 → 72 · tg256 74.8 → 69.8 → 7.7
I left this one blank. Prefill collapsed ~40× from 20k→100k while decode fell only ~10×, and I didn't have an explanation at the time.
Prefill cost scales with attention over the whole context and, at 100k, the KV cache blows past VRAM headroom into host spill — so it falls off a cliff. Decode only touches one token's work per step, so it degrades far more gently.
The cliff smelled like attention-memory. Could Flash Attention rescue it? → toggle FA.
| config | fa | prefill t/s | decode t/s |
|---|---|---|---|
| no ncmoe | 0 | 259 | 7.15 |
| no ncmoe | 1 | 2472 | 32.90 |
| ncmoe = 4 | 0 | 2826.96 | 74.81 |
| ncmoe = 4 | 1 | 2831.58 | 74.80 |
Flash attention does online softmax by tiling — slices of Q, K, V loaded and computed in on-chip cache near the CUDA cores, never written back to RAM until done, cutting GPU-RAM traffic. If you move some experts to the CPU, that disturbs it, because some activations have to move from CPU back to the GPU cache, hampering FA's gains.
The FA mechanics are right, but the causal link isn't — attention stays on the GPU regardless of ncmoe. FA is a memory-pressure valve: without offload at 20k it saves enormously (9.6×); with ncmoe=4 the pressure is already relieved, so FA has nothing left to do — the offload, not the experts-in-FA idea, is doing the work.
FA only helped when nothing else had. Could micro-batch matter at depth? → ubatch.
pp512 228 · 226 · 2138 at ub 256 / 512 / 1024 — a 9.4× cliff
Leveraging more CUDA cores and pushing it toward compute-bound.
Partly — but the real trigger is that ub=1024 ≥ the 512-token prompt, so it processes in a single pass; at 256 the prompt splits into chunks that each re-read the 20k KV cache. Same cliff I saw on the Mac, sharper.
Does the whole ncmoe4 + fa1 recipe hold as prompt size grows? → a cross-check.
pp4096 359 · 2690 · 1887 across depth 10k / 20k / 50k
No separate hypothesis here — a deliberate sanity sweep to confirm the ncmoe=4 + fa=1 recipe held as I varied prompt size and depth. It did.
Config held. Now the question I actually cared about: which quant is fastest? → quant comparison.
| quant | size | prefill t/s | decode t/s |
|---|---|---|---|
| Q6_K | 7.20 GiB | 8185 | 222.80 |
| Q4_K_M | 4.95 GiB | 9215 | 278.43 |
| Q3_K_M | 3.66 GiB | 9434 | 294.16 |
| IQ3_XS | 3.30 GiB | 9437 | 291.01 |
| Q2_K | 2.72 GiB | 7974 | 315.45 |
Both prefill and decode should rise as precision drops — quantization pushes you toward compute-bound (faster low-precision FLOPs) and eases memory (fewer bytes moved per second).
Half of that holds. Decode is bandwidth-bound, so smaller does win — Q2_K has the fastest decode (315). But prefill is compute-bound, and dequant-kernel efficiency isn't monotonic in bit-width: Q2_K's kernel is less optimized than the K-quants, which is why it lands lowest on prefill despite being the smallest file. Fewer bits ≠ faster prefill.
Prefill and decode pulled in opposite directions. Could more CPU threads change the offload picture? → thread sweep.
pp4096 ~3135 · tg256 ~78 — dead flat from t=2 to t=16
I wrote "needs explanation" and moved on.
With ncmoe=4 the offloaded expert FFN runs on the CPU and is RAM-bandwidth-bound — two threads already saturate the memory bus, so extra cores have nothing to do. Everything else is on the GPU.
Threads were a dead end — informatively so. One more throughput idea before I stopped chasing speed. → a different backend.
pp512 577 · 586 · tg128 43.2 · 42.6 — flat 10k→20k
KV quantization shrinks the cache without losing much quality (per the TurboQuant paper), so you can hold more context at respectable prefill — there's still some GPU headroom and more efficient weight transfer. The decode numbers, though, are hard to believe.
Mechanism's right, and the flat curve is exactly what a compressed KV cache should give. Trust the shape; the 43 t/s decode goes on the re-measure list before I quote it.
But every number so far is about speed. Fast isn't the same as faithful. → perplexity & KL-divergence.
Quantization fidelity: “how fast” vs “how faithful”
Up to here I’d been optimizing throughput. But the reason you quantize is to deploy the small file — so the real question is whether the small file still thinks like the big one. I measured perplexity on wikitext-2, and KL-divergence of each quant’s token distribution against the BF16 original. They tell very different stories.
Two instruments, two verdicts. Perplexity (blue) says every quant down to IQ3 is basically fine — Q4_K_M even edges out BF16, within error. KL-divergence (rust) tells the truth: the per-token distribution drifts steadily, and Q2_K has left the building.
| Quant | PPL | Median KLD | Same top-p |
|---|---|---|---|
| Q6_K | 33.01 | 0.012 | 91.6% |
| Q4_K_M | 32.36 | 0.046 | 85.6% |
| Q3_K_M | 32.78 | 0.152 | 76.2% |
| IQ3_XS | 34.14 | 0.253 | 70.4% |
| Q2_K | 37.76 | 0.387 | 65.2% |
Read the Q2_K row slowly. Its perplexity (37.8 vs BF16’s 33.0) looks like a modest tax. But its median KL-divergence is 0.387 — where anything past ~0.2 means the distributions have meaningfully parted ways — and it agrees with BF16’s top token only 65% of the time.
Q4_K_M is the quality floor. Everything below it looks fine on the coarse metric and is quietly broken on the sensitive one.
An eval I actually trust
Standard benchmarks are contaminated — the questions have leaked into training sets, and the scores tell you about memorization as much as capability. So I hand-wrote my own: 140 questions across 7 categories, skewed toward the inference-engineering work I actually do (KV-cache math, quantization gates, VRAM budgeting), with a handful of general-domain controls. It’s private — I’ll share it one-on-one but not publish it, precisely so it stays uncontaminated.
| Category | Count | Weight | Scored by |
|---|---|---|---|
| Coding | 25 | 20% | pass@1 (pytest) |
| Tool use | 25 | 20% | trajectory match |
| Math | 20 | 15% | deterministic |
| Logical | 20 | 15% | deterministic |
| Info generation | 20 | 15% | LLM judge |
| Planning | 15 | 10% | LLM judge |
| Termination | 15 | 10% | loop detection |
Scoring is weighted so the final answer carries 0.6 and can’t be rescued by partial credit — a wrong answer never passes. Subjective categories escalate to Claude Opus 4.8 as an LLM-judge, emitting a terse yes/no per rubric dimension. A taste of the questions:
- CODE-001 (pass@1): implement
is_palindrome(s)— alphanumeric only, case-insensitive, empty string counts. Graded by running the model’s code against 5 hidden tests. - TOOL-012 (trajectory, budget 2): find the on-disk GiB of a model at 4.5 bpw — but you must fetch the unknown parameter count first. The trap: calling the size tool before you have the params, or guessing 7.0.
- INFO-009 (judge): two sources report 620 vs 580 tok/s for the same RTX 4090. Correct behavior is to flag the conflict and give a range — not silently average or pick one.
LFM2.5 vs Claude, on my turf
I ran a Claude model as the frontier baseline, then every LFM2.5 quant through the identical 140 questions.
~7 points behind frontier — and a flat line across quants. The open model lands closer to Claude than I expected. But the five blue bars, BF16 through Q2_K, are indistinguishable. That flat line is the problem.
The good news: LFM2.5 scores ~0.70 to Claude’s 0.77 — a ~7-point gap to a frontier model, on questions written to be hard and uncontaminated. For a model that runs on a hobbyist GPU, that’s genuinely close.
The unsettling news: the eval can’t tell the quants apart. Q2_K (0.705) scores the same as BF16 (0.705). If this scoreboard were my only instrument, I’d happily ship the 2.7 GiB Q2_K build and feel smart about it.
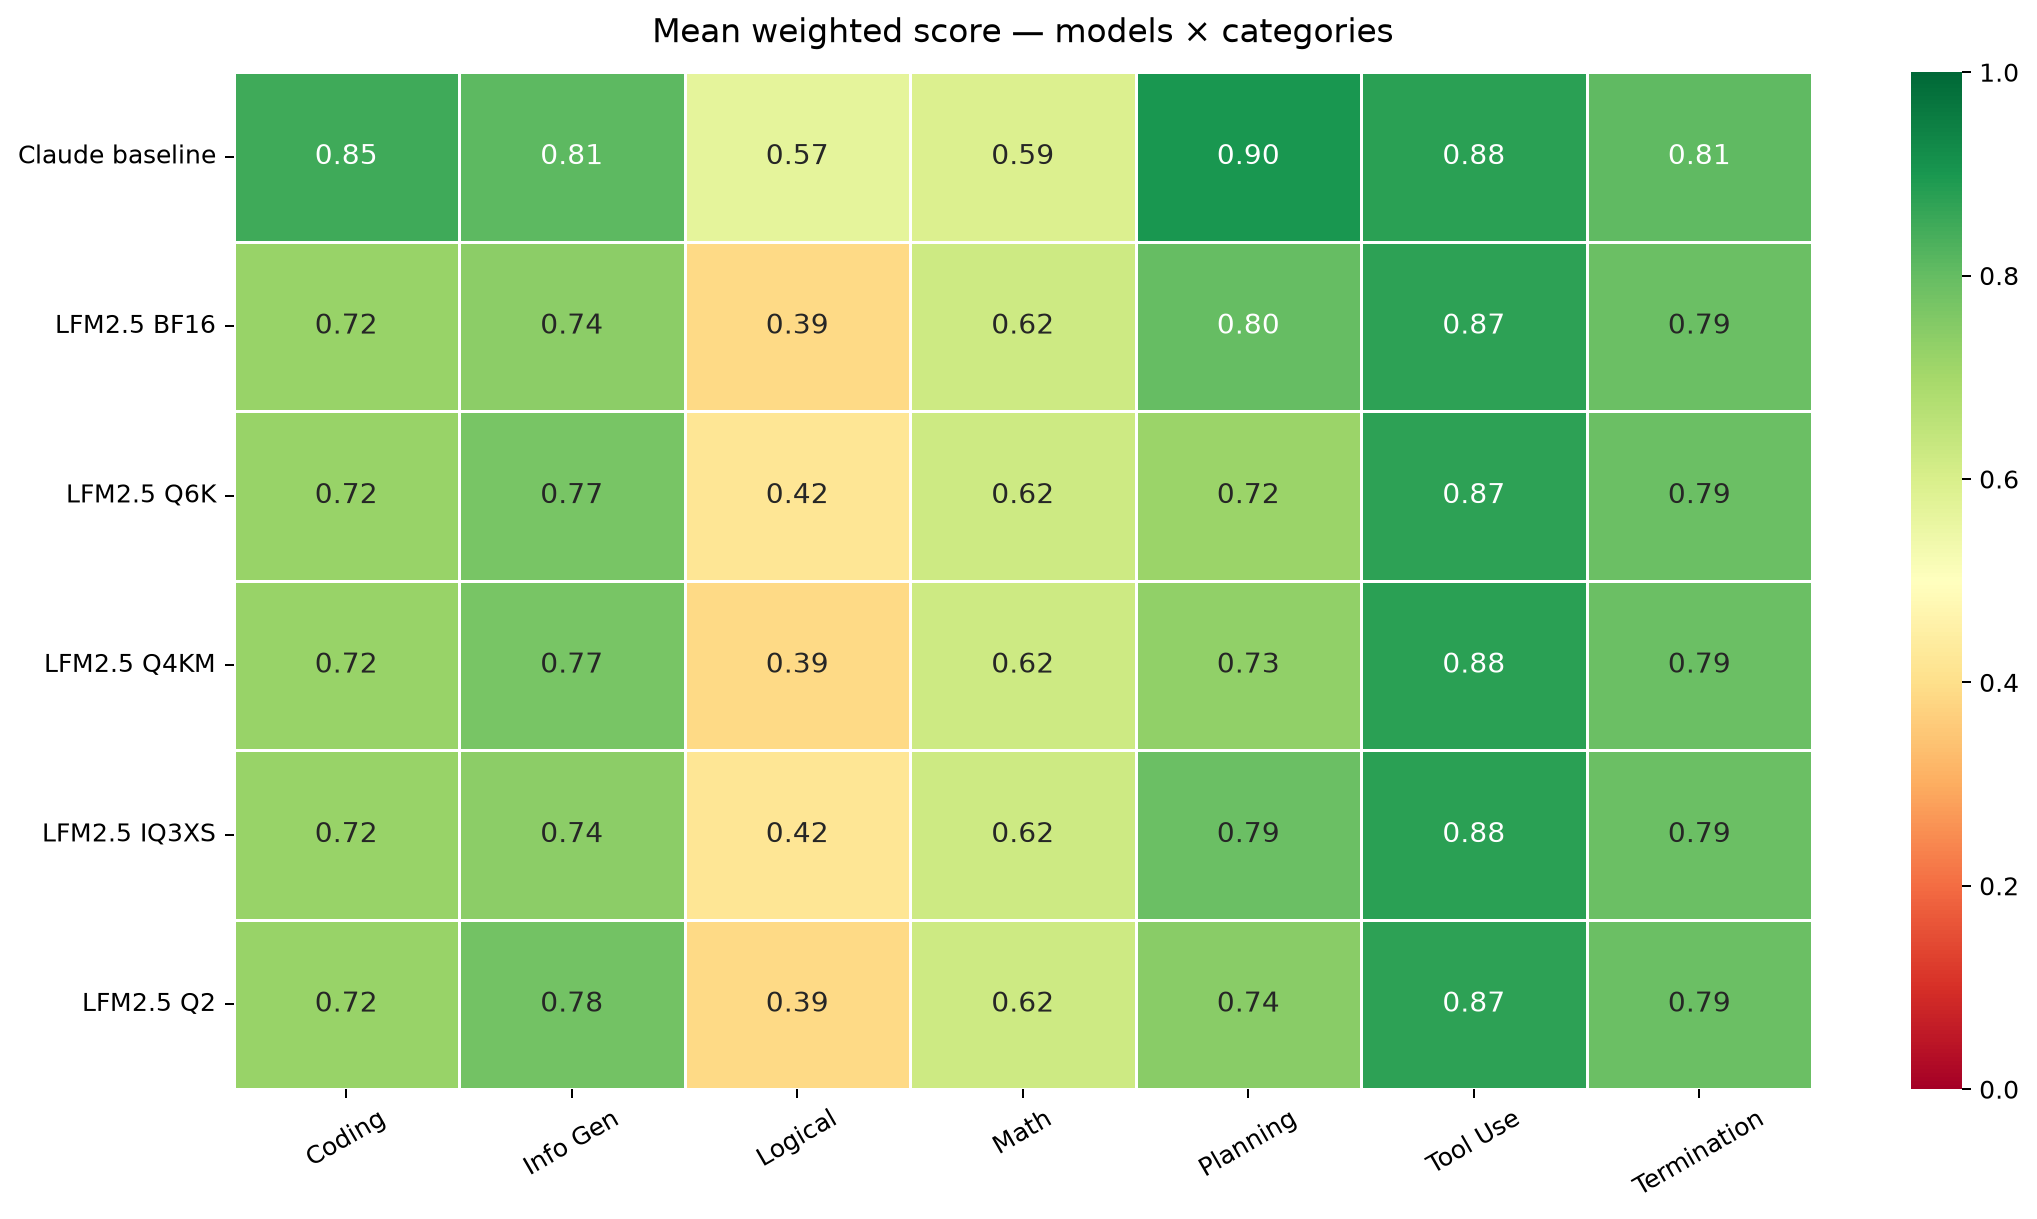
Models × categories. Claude leads almost everywhere; the LFM quants are near-identical rows — the same near-flat behavior the bar chart shows, category by category.
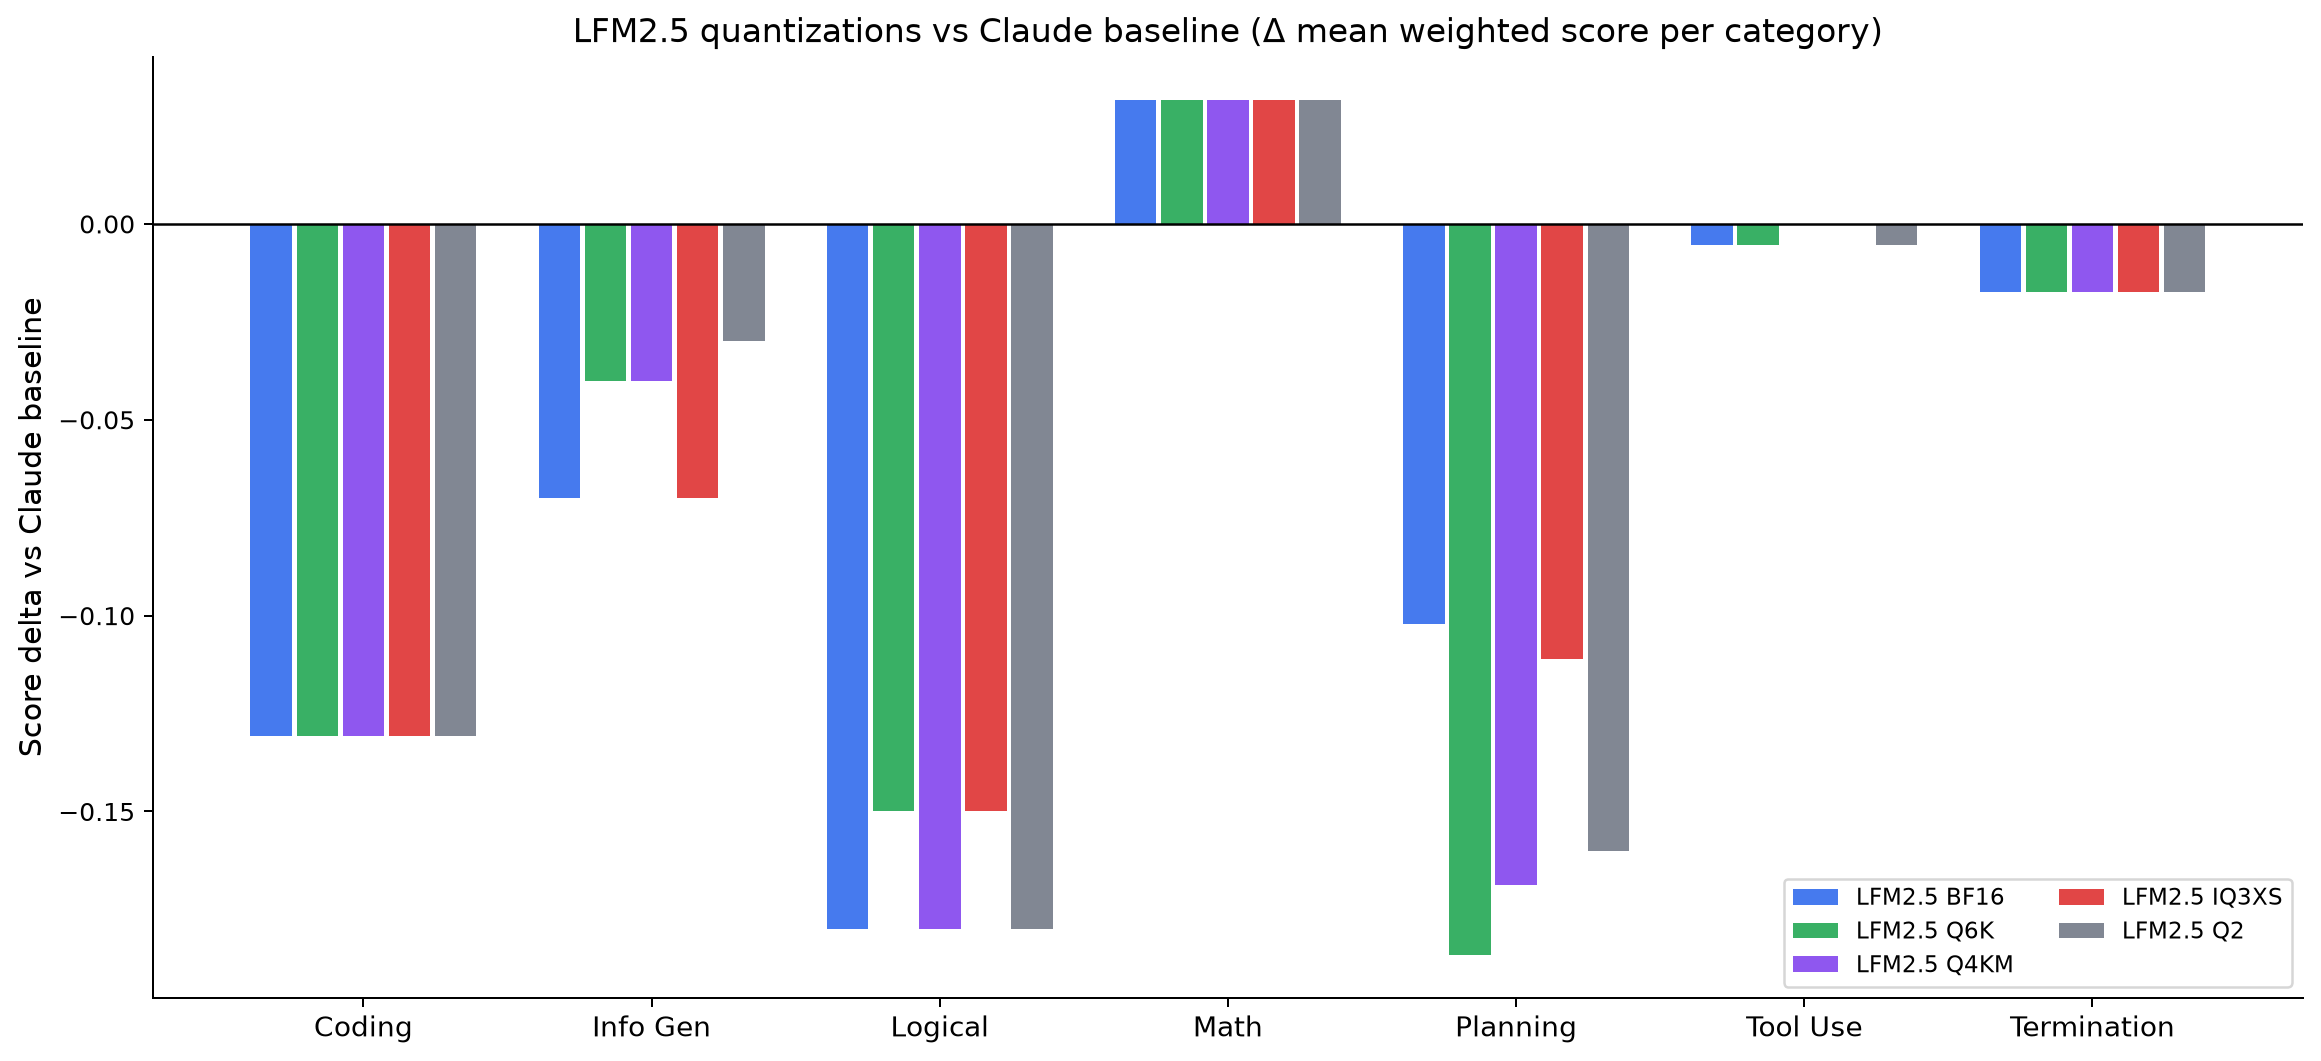
Where the gap actually lives. Per-category delta vs the baseline — the open model is competitive on some categories and clearly behind on others, which the single mean score hides.
Why I don’t trust the rosy quant numbers
My throughput benchmarks love Q2_K. My 140-question eval can't distinguish it from BF16. Both are seductive and wrong. KL-divergence — the one instrument sensitive enough to see per-token drift — says Q2_K agrees with the original only 65% of the time. A coarse pass/fail eval rewards getting the gist right while the distribution quietly rots. Neither speed nor a headline pass-rate is sufficient evidence to trust a quant.
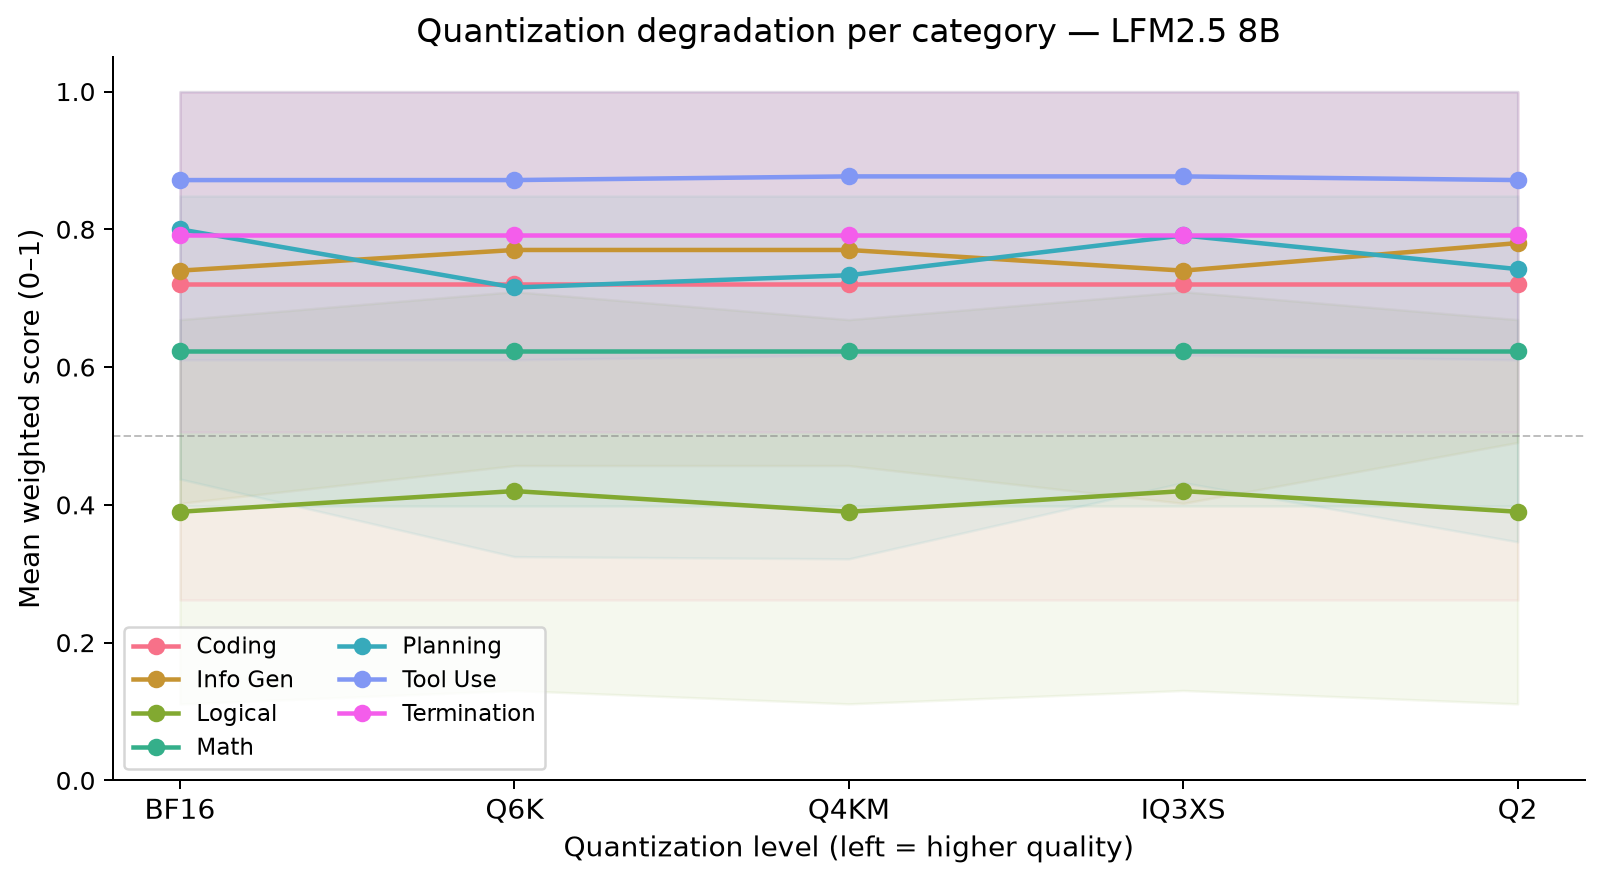
The blind spot, drawn. Eval score vs quantization level, per category — nearly flat all the way down to Q2_K. The eval simply cannot see the degradation that KL-divergence measures.
The resolution is almost embarrassingly simple: a pass/fail score is a low-resolution instrument. Many questions have a right answer a slightly-degraded model can still stumble into — so it passes, while its token distribution has drifted far enough to matter in open-ended, multi-step, or agentic use where errors compound. KLD sees that drift; a scoreboard doesn’t. So my adoption rule: Q4_K_M is the floor, and Q3_K_M / Q2_K are off the table no matter how good their benchmarks look.
Since the whole point is trusting the process, here’s where mine is still weak:
- Every dataset item is currently
human_verified: false. I wrote them; I haven’t audited them cold. - A handful of agentic questions fell back to schema-inferred mock tool responses rather than authored ones — those trajectories aren’t authoritative yet.
- My baseline is a Claude model judged by Claude Opus — which breaks my own “use a different model family as judge” rule. The LFM runs honor it; the baseline doesn’t.
- I haven’t run judge calibration against human labels yet, so I can’t quote an agreement rate.
- Q3_K_M is in the perplexity/KLD study but never made it into the eval — a gap I only noticed writing this up.
Open questions and next steps
This phase is done, for now. What I’d genuinely like help with:
- Why does prefill quadruple at exactly
d1024(E1)? - Why was decode ~2× lower on the M2’s GPU than its CPU?
- Are the Vulkan TurboQuant-KV decode numbers real?
- What actually trips the
n_ubatchcliff at 1024 (E6)?
I have hypotheses for all four and proof for none. And the to-do list: human-verify the dataset and author real mock tool responses; run judge calibration to ≥80% agreement; add Q3_K_M to the eval; re-measure the throughput rows I flagged as suspect; stand up a proper different-family baseline.
The meta-lesson, four weeks in: choosing an open model to depend on isn’t one measurement, it’s three that disagree — can I run it, can I trust the small version, and can I measure it honestly. The disagreements are where the truth is.
Corrections welcome — especially on the four open questions. That’s not false modesty, it’s a bug report.