This is the second half of a pair. The first post, The model side of self-improvement: six toy runs, changed the weights and held everything else still. This one does the opposite. The weights never move.
One correction to that earlier post while I am here. I described this track as freezing an 8B model. The model actually under test is Qwen 3.5 9B, and it has been throughout.
1. The question, in plain terms
An agent is two things stacked together:
agent = model + harness
The model is the weights. It reads text and writes text, and that is all it does. The harness is everything wrapped around it to turn that into something that can do work: the instructions it reads before starting, the tools it is allowed to call, the code that runs between calls, and the logic that decides when it has finished.
When an agent fails a task, either half can be at fault. The model may genuinely not know how to solve the problem. Or the model may know perfectly well, and the harness let it stop after two steps, or retry the same broken command forty times, or declare success without ever running the test.
Those two failures look identical in a score. They need completely different fixes.
So this experiment freezes one half and works on the other. The 9B is byte-identical from the first trial to the last. Every change happens in the harness, and every change is written by a much stronger model reading the weak model’s failure traces.
What I am measuring: does the same frozen 9B solve more tasks, more reliably, when a stronger model is allowed to rewrite the scaffolding around it? And can I tell a real gain from a lucky one at this sample size?
2. Where the plan comes from
The organising idea comes from Self-Improvements in Modern Agentic Systems: A Survey (Ren et al., 2026). It cuts an agent the same way, then cuts the harness into four named parts:
A = (θ, Σ) where Σ = (p, m, T, g)
θ is the weights. Σ is the harness, made of p the prompt, m the memory, T the tools, and g the control logic. Any self-improving system updates one of those five things. The survey sorts a large pile of prior work by which one it updates.
That gives the project an obvious ordering. Change one part at a time, so any gain can be attributed to a specific part rather than to a bundle. Three phases:
- Agent core (p and g). How the agent plans, acts, observes, verifies, and replans. Whether it notices it is stuck in a loop. Whether it is allowed to declare victory without checking. This post.
- Tool layer (T). Tool contracts, recovery when a call fails, handling results too big for the context.
- Memory (m). Keeping state across a long session, and compacting it when the window fills.
Prompt and control logic move together in phase one because at 9B they are the same intention with two implementations. A rule in a markdown file asks the model to check its work. A gate in code refuses to let it finish until it has. The first is a suggestion. The second happens whether the model reads anything or not.
Skills stay frozen and human-written in every phase, so the attribution stays clean.
The closest published precedent is Agentic Harness Engineering, which evolves a harness over ten iterations on this same benchmark and then freezes and transfers it. The difference here is that the proposer is a separate stronger model, the executor never sees its own scores, and the accept decision is a statistical test rather than a judgement.
3. Why Pi, and what “editing the harness” means
The agent framework is Pi, a deliberately minimal terminal agent. That minimalism is the whole reason I picked it.
Pi ships a system prompt under a thousand tokens and four core tools: read, write, edit, bash, plus grep, find and ls. It has no subagents, no plan mode, no memory system, and no tool-recovery logic in core. Those absences are the point. A batteries-included agent has no bare baseline to measure against, because you cannot tell which of its thirty-five tools and five prompt layers is carrying a result. Pi starts near zero, so every mechanism that exists is one I added and can remove.
The second reason is that Pi’s extension API is expressive enough to build real control logic without forking anything. Extensions are TypeScript modules that subscribe to typed events:
pi.on("tool_call")           // fires before a tool runs. CAN BLOCK IT,
                             // can rewrite the arguments, can inject text
pi.on("tool_result")         // fires after, can patch the result
pi.on("before_agent_start")  // inject messages, edit the system prompt
pi.on("context")             // filter or modify messages before each model call
pi.registerTool(...)         // add a tool the model can call
A blockable pre-tool hook is enough to build a completion gate, a loop detector, and a budget checkpoint. That is exactly the phase-one shopping list.
So the harness surface, the set of things the teacher is allowed to write, is three paths and nothing else:
| Path | Layer | What it is |
|---|---|---|
AGENTS.md |
p | Markdown the agent reads at the start of every task. Always loaded. |
.pi/extensions/*.ts |
g | TypeScript middleware. One module per mechanism. Anything that acts lives here. |
settings.json |
p | Pi project settings. |
Any proposal touching a path outside this list is rejected before it is applied. The archive only hashes these three, so an edit elsewhere would look real and silently do nothing.
Each trial runs in its own Docker container. The harness is uploaded into the project directory at the start of the trial and dies with the container, so nothing leaks between tasks.
4. The rig
One desktop. No cluster, no cloud inference, which is a constraint that shapes every later decision in this post.
| Component | Setting | Note |
|---|---|---|
| Model | Qwen 3.5 9B | frozen for the entire experiment |
| Weights | Qwen3.5-9B-UD-Q8_K_XL.gguf, 12.96 GB |
Unsloth dynamic Q8 |
| Server | llama.cpp llama-server, -np 1 -c 131072 -ngl auto |
one slot. Two slots did not fit in VRAM. |
| Context window | 131,072 tokens | matched to the base run |
| Max tokens per reply | 33,000 | raised from 8,192 so the window is the limit, not the cap |
| Temperature | 0.8 | llama.cpp’s default. A confession, not a decision. |
| GPU | RTX 5060 Ti, 16 GB | Windows, Docker Desktop for the task containers |
| Agent | Pi, pi-qwen adapter v0.73.1 | reaches the server at host.docker.internal:8080 |
| Benchmark runner | Harbor | one container per trial, self-contained verifiers |
| Teacher | claude-opus-4-8 |
writes harness edits. Decides nothing. |
What the token accounting actually looks like
Two words worth defining, because they drive everything about running an agent locally. Prefill is the model reading the prompt: it processes the whole conversation so far before it writes anything. Decode is the model writing its reply, one token at a time. Prefill is parallel and fast per token. Decode is sequential and slow.
In a chatbot the prompt is short and most of the time is decode. In an agent the conversation grows with every tool result, so by turn forty the model re-reads an enormous transcript to emit a twenty-token command. Summed across every model response:
| Measure | Bare agent, 135 trials | Best harness, 69 trials |
|---|---|---|
| Prompt tokens processed fresh | 3.34 M | 1.53 M |
| Prompt tokens served from cache | 263.3 M | 306.6 M |
| Cache hit share of prompt volume | 98.7% | 99.5% |
| Tokens generated | 2.55 M | 1.22 M |
| Prompt to output ratio | 105 : 1 | 252 : 1 |
| Effective generation rate | 11.5 tok/s | 15.9 tok/s |
Two honest caveats on that last row. It is total tokens generated divided by total agent wall time, so it includes every second spent running the model’s bash commands. The true decode rate is higher. And I cannot separate prefill from decode any more precisely than this, because Pi’s trace format timestamps messages but not tool executions, so generation and tool time share one clock. That is a logging gap I would close if I were starting again.
The ratio is the number that matters. This workload is roughly a hundred parts prompt to one part output, and the prompt cache absorbs nearly all of it. On a 16 GB card the binding constraint is the context window and the cache, not decode speed.
5. Baseline: 18%
Terminal-Bench 2.0 is 89 tasks a competent engineer would do in a terminal. Build this package from source without X11. Recover data from a git history. Get this gRPC service passing its tests. Each task ships its own verifier, which writes a 1 or a 0. No judge model, no partial credit.
Bare Pi with the 9B, one attempt per task, 15 July 2026:
16 of 89. 18.0%.
Two numbers from that run set up everything that follows. The verification rate was 11.2%, meaning that in nearly nine trials out of ten the model never ran a single check after its final edit. And of the 89 trials, 65 ended cleanly, 13 ran into the agent timeout, and 8 filled the entire 131k context window and died.
Timing is the other constraint, and it is severe. On the later 135-trial run the mean trial took 27 minutes and the median took 13, with a long tail: the 90th percentile was 82 minutes and the longest single trial ran three hours. Running one trial at a time, a 45-task pass at three attempts each is about 34 hours of wall clock.
The whole project came to roughly 370 hours of GPU time across 790 trials. Every evaluation pass in this post costs a day or more, which is why the experiment is built around 45 tasks rather than 89, why a phase is three cycles rather than ten, and why several things I would like to have measured are still unmeasured at the end of it.
6. Why those 73 failures failed
A pass rate tells you nothing about what to build. I needed to know why each failure failed, in language specific enough to point at a fix.
So I gave all 89 trajectories to Claude Opus 4.8 and had it label every task, with the trial’s own telemetry attached: turn count, tool calls, the longest run of identical calls, how many distinct calls it made, wall time, output tokens, error count, and which tools it used. Each task came back with a primary failure mode, any number of secondary modes, a difficulty, a judgement on whether a harness could plausibly fix it, and a written justification.
A worked example
Take a task where the model has to modify a statistical model fit and re-run it. The label that came back looked like this:
primary   : model_capability
secondary : [missing_verification, doom_loop]
difficulty: hard
liftable  : true
class     : learnable
Read that as a sentence. The main reason it failed is that the task was probably beyond it. But it also never checked its own work, and it got stuck repeating itself. And despite the primary label, there is enough signal here that better scaffolding might get it over the line.
That combination is the single most important pattern in the whole dataset, and it is why the obvious way to read the labels is the wrong way.
The obvious reading, and the useful one
If you count only the primary label, model_capability takes 46 of the 89 tasks and there is nothing to build. A harness cannot teach a model something it does not know.
But the primary label answers “what is the single biggest reason this failed”, and a harness does not fix biggest reasons. It fixes specific mechanical behaviours, and those show up in the secondary labels. So count a mode whenever it appears at all, primary or secondary. A task with three labels contributes to three rows, which is why the column below adds up to more than 89.
| Failure mode | What it looks like in a trace | Tasks affected | Fixed by |
|---|---|---|---|
missing_verification | Edits the files, never runs the test. | 26 | control logic |
environment_misunderstanding | Assumes a package, path or service that is not there. | 26 | prompt + memory |
premature_completion | Announces it is done with the work half finished. | 24 | control logic |
planning | Starts editing before working out what it is doing. | 20 | prompt + control logic |
doom_loop | Runs the same failing command again and again. | 20 | control logic |
tool_misuse | Malformed calls, or the wrong tool for the job. | 13 | tool layer, phase 2 |
context_loss | Forgets what it already established earlier in the session. | 3 | memory, phase 3 |
model_capability | Genuinely does not know how. | 56 | nothing here. Hand back to the model track. |
How many of the 89 tasks show each failure mode anywhere in their labels. Highlighted rows are the ones a control-logic block can act on, which is what made them phase one.
Three of the top five are control logic, covering 26, 24 and 20 tasks. And most of the model_capability tasks carry one of those three as a secondary, exactly like the worked example above.
That reads as a model that often had the ability, and a harness that let it stop early, thrash, or skip checking. That was my thesis going in, and phase one was built to test it.
One honesty note. This triage read all 89 traces before I had split off a test set, which I knew at the time and flagged in the plan. The held-out tasks are therefore not perfectly naive: their failure modes helped shape the taxonomy, even though their contents never reached a proposal.
7. Which tasks are worth trying
Running all 89 tasks three times each would be a fortnight of GPU per evaluation pass, and most of it would be wasted on tasks the model always fails or always passes. Neither moves a lift signal. So the triage also sorted every task into one of four buckets:
- learnable (44 tasks). Got somewhere real. Better scaffolding could close the gap. This is the target.
- capability floor (28). Got nowhere. No scaffold will change that.
- saturated (13). Already passing cleanly. Useful as a tripwire, not as a target.
- environment invalid (4). The task itself is broken.
The working set is 45 tasks. 32 targets, being every task that is both learnable and judged harness-liftable. 13 guards, being the saturated ones, which never get split and instead run alongside every evaluation to catch a harness that improves one thing by breaking another.
The 32 targets are split into Dev, Val and Test, balanced on difficulty crossed with failure mode so each split has the same mix, with a fixed seed so it is reproducible.
- Dev, 14 tasks. The only thing the teacher ever sees.
- Val, 10 tasks. What decides whether a harness survives. The teacher never sees these traces.
- Test, 8 tasks. Sealed by task id, opened once at the very end.
Difficulty splits 51 hard, 35 medium, 3 easy across the benchmark. All three easy tasks are already saturated, so the target pool contains no easy tasks at all and every split is half hard, half medium.
The second benchmark, held out completely
A harness tuned on Terminal-Bench that only helps on Terminal-Bench has learned the benchmark rather than the model. The generalization check needs a benchmark the teacher never sees at all. I wanted SWE-bench Verified and the runner’s registry does not carry it, so SkillsBench stands in: 87 tasks, self-contained verifiers, binary reward.
I started a full 87-task sweep and killed it 51 trials in, because at 15 minutes a task it is a multi-day run and most of it is tasks a 9B either always fails or always passes. Those 51 trials produced 2 passes, which was enough to confirm the shape. So I banded the set against published pass rates from the two weakest models with leaderboard coverage, as a generous proxy for a 9B ceiling, and locked a 15-task run set: 6 tasks a capable model solves without any help, and 9 where scaffolding is known to be worth 30 points or more.
Bare agent on those 15, one attempt each, 28 July: zero. One of the 15 is not measurable at all, because the agent binary fails to install in its container and the trial dies with pi: command not found. That reproduces identically in every later run.
8. The teacher and the student
The student is the frozen 9B. It solves tasks. It never learns anything, never sees its own scores, is never asked to improve itself, and has no idea an experiment is happening.
The teacher is Claude Opus 4.8. Once per cycle it reads a summary of how the student failed, and writes exactly one new block of harness. It returns whole files, not diffs, and may only write the three paths in section 3.
What the teacher is shown matters more than how it is prompted, so the boundary is enforced in code rather than in wording. The rule separates the problem from the failure:
- The problem never reaches it. What the task was, what solving it requires, what the expected output looks like. A block written from those details encodes one task’s solution and would be a fix that does not generalize.
- The failure always reaches it. How the agent broke, which error it kept hitting, how many times, how far in, whether it ever checked its work.
In practice that means per-category counts, trace symptoms, and a few sanitized excerpts with tool results truncated to their first line. An error’s class is failure detail. A full assertion diff showing expected against actual is problem detail. The boundary between them is about one line long.
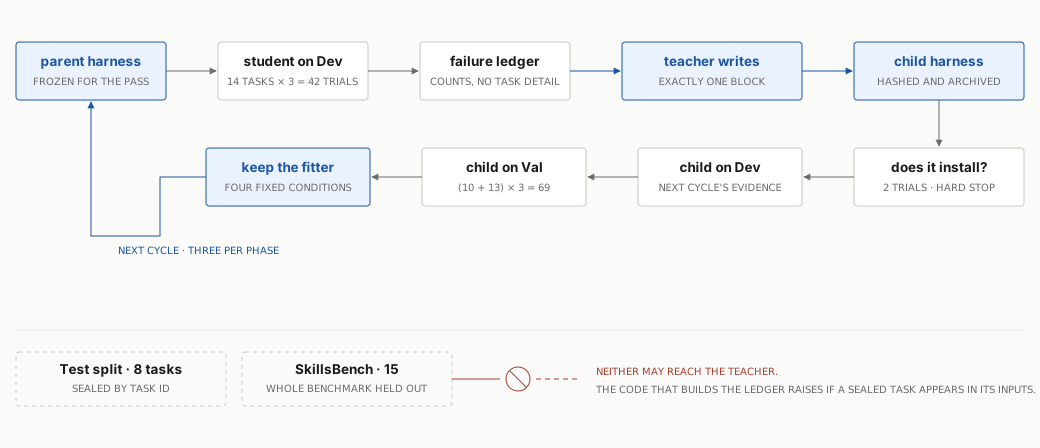
The teacher proposes and, separately, explains afterwards what it thinks happened. It votes on nothing. That separation is what stops the loop confirming itself, since a model asked whether its own edit helped will tend to say yes.
9. How a harness earns its place
This is the part that decides whether the whole experiment means anything, so it is worth being precise. Two metrics first.
Every evaluation runs each task three times, because a 9B is not deterministic and one attempt tells you almost nothing. With c passes out of 3 on a task:
- pass@1, competence. Average of c/3. How often a single attempt works.
- pass@3, ceiling. Fraction of tasks solved at least once. What the model can reach on a good day.
- pass^3, reliability. Fraction of tasks solved all three times. What you can actually depend on.
- fragility gap = pass@3 − pass^3. Tasks it can sometimes do but cannot do repeatably. A model with a big gap already has the capability and is being let down by everything around it.
The objective is stated on the gap. A good harness turns sometimes into always. It should push pass^3 up toward pass@3 without the ceiling needing to move at all.
The four conditions
A candidate harness has to clear all of these:
- It installs. Two trials confirm the files land and the extensions load. If a child does not install, the phase stops rather than continuing and quietly measuring the parent.
- It fixes more than it breaks, on tasks the teacher never saw. Measured on the 10 Val tasks, by the test described below.
- It breaks nothing it already had. The 13 guard tasks run with every pass. Lose more than one and the candidate is disqualified regardless of how well it did on the targets.
- It ranks higher than its parent. Ranked on Val pass@3, with two tie-breaks: how much of the baseline’s unsolved set it now solves, and how much of the baseline’s fragility gap it closes.
Why aggregate pass rates play no part in condition 2: on a 10-task split, one task flipping moves the pass rate by ten points. At that sample size a rate is mostly noise, so the decision runs on paired per-task outcomes instead.
The test, in plain terms
Compare the child against its parent one task at a time. Throw away every task where both got the same result, because it tells you nothing. What is left is the tasks that changed: some the child fixed, some it broke.
If the harness made no real difference, each of those changes is a coin flip. So the only question is how unlikely the observed split would be from fair coins. That is what an exact one-sided McNemar test computes, and at these sample sizes you can read it off a table. With no broken tasks it reduces to “how many coin flips in a row”:
| Fixed | Broken | p | Which harness scored this |
|---|---|---|---|
| 2 | 0 | 0.250 | two flips the same way |
| 3 | 0 | 0.125 | the 0.15 bar sits here |
| 4 | 0 | 0.063 | |
| 5 | 0 | 0.031 | the 0.05 bar sits here |
| 6 | 0 | 0.016 | the final harness, section 11 |
| 5 | 2 | 0.227 | seed plus stop guard |
| 3 | 3 | 0.656 | orientation gate |
| 0 | 1 | 1.000 | budget guard |
Why the bar is 0.15 and not 0.05
Read the p column. The available values are sparse, because they are all fractions with a power of two underneath. A 0.05 bar cannot be cleared until five tasks change in the child’s favour with none against, and a targeted failure category on a 10-task split rarely contains five tasks in the first place. A bar that can never be reached rejects every candidate whatever its merit, so I set it at 0.15, which puts the requirement at three clean fixes.
Two numbers in this post look alike and are not the same thing. 0.15 is the bar I fixed before running anything. 0.016 is what the final harness actually scored on the wider comparison in section 11. That score would clear a conventional 0.05 bar as well, so the loose threshold is not doing any work for the headline result. Where 0.15 mattered was in the per-cycle accept decisions, and there it never fired anyway: every cycle came back at 0.5 or worse.
Three cycles per phase, and every cycle runs. I removed an early-stopping rule partway through, because a plateau confuses “this block did not help” with “no later block will”, and a phase that stops early keeps whatever harness it happens to be holding. Cycle 3 produced the only real result of the phase, and an early stop after two flat cycles would have thrown it away.
10. What the teacher actually wrote
The teacher did not start from a blank page. It started from Pi’s own AGENTS.md, the markdown file Pi loads at the beginning of every task, plus two extensions.
The markdown writes out a plan-execute-verify loop in longhand. The core of it:
## 3. Verify

Run that step's `check:` command. Read its full output.

A step is done only when its check command exits 0. Your own belief that the
edit was correct is not evidence. Reading the file back is not a check.

## 5. Replan when stuck

After **two** failed attempts at the same step, stop editing.
...
A third attempt at an unchanged approach is always wasted.
The two extensions make two of those rules mechanical. loop-guard.ts watches tool calls and, when the same call repeats three times in a row, says so in the model’s own context and names what it is repeating. verify-gate.ts registers a finish_task tool and refuses it while there is an unchecked edit outstanding.
Then the teacher got three cycles. It wrote one block each time.
Cycle 1: the stop guard
The ledger said 8 of 9 failing Dev tasks ended having never run a check after their last edit, and most ended “clean”, meaning the model stopped of its own accord. The teacher’s diagnosis was that verify-gate had a hole: it refuses the finish_task tool, but a 9B frequently just stops without calling it, so the gate never fires.
So it bound the end-of-turn events and injected this at the moment the model tries to stop with an unchecked edit:
STOP BLOCKED: you changed the workspace but have not checked it since your
last edit. Do NOT finish yet.
Do exactly this before you stop:
  1. Run the one command that reproduces what the task asked for -- its test
     suite, the program you built, or a diff against the expected result.
  2. Read that command's full output.
  3. If the output does not show the intended result, the task is NOT done:
     fix the cause it reveals and repeat.
  4. Only after a check passes on the current files may you conclude.
Take that next action now.
It bounded itself to two nudges per session, and required at least one further tool call before re-nudging, so the guard cannot become its own doom loop.
Cycles 2 and 3
Cycle 2 wrote an orientation gate, firing once on the first workspace-changing tool call if the model had started editing before inspecting anything or writing a plan.
Cycle 3 wrote the stagnation guard, and this is the one that worked. Its reasoning, quoted from its own file header, was that the biggest untouched lever was non-convergence rather than verification: the failing tasks did not stop early, they ran forever, one reaching 185 turns with 21 failing results. Sessions like that never finish gracefully, so verify-gate and stop-guard, which only act when the model tries to conclude, never get their chance to fire.
The mechanism is simply a counter. At 40, 80, 120 and 160 tool calls it injects one short escalating message. The first is a consolidation prompt:
CHECKPOINT (40 tool calls). Pause and write three short lines, then act:
  GOAL: what the task asks for, in one sentence.
  DONE: what you have already VERIFIED works (name the check that proved it).
  NEXT: the single most direct action that closes the remaining gap.
Then do NEXT. If you have been trying variations of one approach and it is
still not working, switch to a genuinely different approach now.
By the last checkpoint it has become an instruction to land the plane:
CHECKPOINT (160 tool calls). Budget is nearly gone. Do ONLY this: run the
single command that checks what the task asked for, read its full output, fix
the one thing it reveals if the fix is quick, then finish with whatever
verified state you have. Start nothing new.
That is the entire mechanism. A 9B has no internal sense of budget and will thrash until the trial is killed, so the guard supplies one from outside.
A note on the shape of these edits, since it was a deliberate constraint. The teacher is told to prefer executable middleware over prose, because a 9B will skip a paragraph asking it to verify but cannot skip a gate that blocks the tool. Every block above except the seed markdown is code that acts.
11. Results
Phase 0 first: the bare agent on all 45 pool tasks, three attempts each, 135 trials, 34 hours.
| Split | Tasks | pass@1 | pass@3 | pass^3 | fragility gap | verification |
|---|---|---|---|---|---|---|
| All 45 | 45 | .341 | .444 | .222 | .222 | .141 |
| Dev | 14 | .143 | .286 | .000 | .286 | .071 |
| Val | 10 | .200 | .400 | .000 | .400 | .100 |
| Guard | 13 | .641 | .692 | .538 | .154 | .128 |
pass^3 is zero on both working splits, meaning that across 24 addressable tasks not one was solved in all three attempts.
Phase A ran 1 to 11 August. Because cycles 1 and 2 both reverted, the parent never moved, so all three children branch off the same harness and each adds exactly one extension. By accident that makes it a cleaner three-way comparison than the design intended.
| Cycle | Block added | Aimed at | pass@1 | pass@3 | pass^3 | Outcome |
|---|---|---|---|---|---|---|
| baseline | nothing, bare Pi | reference | .200 | .400 | .000 | n/a |
| seed | Pi’s AGENTS.md, loop guard, verify gate | the starting point | not run | not run | not run | Dev only |
| 1a | stop guard | stopping without checking | .233 | .400 | .000 | kept by operator decision |
| 1b | budget guard | runaway sessions | .167 | .300 | .000 | rejected: 0 fixed, 1 broken |
| 2 | orientation gate | editing before looking | .200 | .300 | .100 | rejected: nothing changed |
| 3 | stagnation guard | non-convergence | .300 | .500 | .200 | kept, frozen best |
The stagnation guard did what it was written to do. Agent timeouts on the Val pass fell from 18 trials under its parent to 11. Tokens on the Val target split fell to 61.8 M, the lowest of any harness including the bare agent at 90.4 M. It scored highest while using the least compute.
The per-cycle verdicts understate the phase, because each one compares a child to its immediate parent on the handful of Val tasks carrying the friction that block targeted. Each harness was also measured against the bare agent on dozens of tasks, and nobody had run that comparison. Doing it like for like, across every task both were measured on:
| Harness | pass@1 | pass@3 | pass^3 | trials passed | fixed / broken | p |
|---|---|---|---|---|---|---|
| bare Pi | .304 | .441 | .147 | 31/102 | n/a | n/a |
| seed + stop guard | .392 | .529 | .235 | 40/102 | +5 / −2 | 0.227 |
| + orientation gate | .304 | .441 | .176 | 31/102 | +3 / −3 | 0.656 |
| + stagnation guard | .373 | .618 | .206 | 38/102 | +6 / −0 | 0.016 |
Dev, Val and guard combined: 34 tasks, 102 trials per harness, each compared against the bare agent by the same paired test. The cycle-1b harness is missing because it never got a Dev pass.
The final harness fixes six tasks and breaks none. That is the 0.016 row of the table in section 9: six changes, all in the same direction, which is as likely as six coin flips landing the same way. It is the only one of the four that costs nothing anywhere it was measured. The orientation gate is the bare agent with different tasks passing: identical pass@1, identical pass@3, identical trial count, three fixed against three broken.
And on the held-out benchmark
The frozen final harness was run against the same 15 SkillsBench tasks on 29 August, with nothing else changed. It scored 1 of 15, against the bare agent’s 0 of 15.
That number is worthless, and section 13 explains why. The short version is that the harness did not load on 12 of the 15 tasks, including the one that passed.
12. The part where my thesis broke
Go back to section 6. I built phase one on that table. Missing verification touched 26 tasks and premature completion touched 24, the two biggest addressable signatures in 89 traces. So the first three blocks I shipped were all verification machinery: a rule in markdown, a gate that refuses the completion tool, and a stop guard that catches the model ending its turn with unchecked work.
All three loaded. All three fired. Every extension prints a marker when it loads and the markers are in the trajectories, so I can prove they ran.
The verification rate did not move. Across the Dev split it went:
| Harness | verification rate |
|---|---|
| bare Pi | .071 |
| + AGENTS.md, loop guard, verify gate | .119 |
| + stop guard | .095 |
| + orientation gate | .143 |
| + stagnation guard (final) | .071 |
Five harnesses, 42 trials each, and the metric those blocks were written to move ended exactly where it started. The lift came from the convergence block, which was written last, as a retry of a cycle-1 failure, aimed at a signature that ranked fifth in the table I built the phase on.
There is a second reversal in the same data, and it took a wider comparison to see.
On the 10-task Val split the harness looks like a reliability win: pass^3 goes from .000 to .200 and the gap closes from .400 to .300, because two tasks moved from two-of-three to three-of-three. That is exactly the pattern section 9 says a good harness should produce. But across the wider 34-task comparison, pass@3 rises 17.7 points while pass^3 rises only 5.9, and the fragility gap widens from .294 to .412.
The harness was supposed to turn sometimes into always. What it actually does is turn never into sometimes.
It reaches tasks the model previously could not touch, and then fails to hold them. That is still lift and it is still worth having. It is a different mechanism from the one I designed for, and the fragility gap, which I picked as the headline metric, moves the wrong way.
My reading, offered as a hypothesis and not a result: reaching further is the first thing a convergence guard buys. A session that used to die at the timeout now finishes, and some of those turn into passes. Holding a result steady is a different problem, and it may be a memory problem, since long sessions lose track of what they already established. If that is right then phase three matters more than phase two, and I have the running order wrong.
13. Three problems I found afterwards
If you run something like this at home, this is the section to read. None of these three showed up in any summary the pipeline produces. I found all of them by going back to raw trial files after the phase was already finished.
1. The harness did not always load
The harness gets copied into one fixed directory inside each container. Pi will only run extensions it finds in the directory the session starts in. The benchmark runner never sets that directory, so the agent starts wherever the task’s own Docker image puts it.
When those two directories differ, the extensions simply do not load, and nothing says so. The files copy successfully. The record of what was installed is written correctly. The middleware never runs.
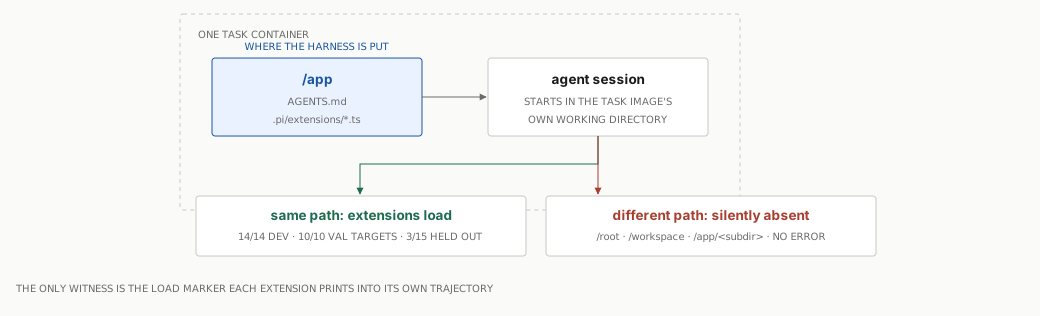
Counting markers across the phase: every Dev task and every Val target loaded, so the numbers the teacher read and the accept test judged are sound. Three guard tasks and twelve of the fifteen held-out tasks did not.
On Terminal-Bench this cost me almost nothing. Every Dev task and every Val target starts in the right directory, so the numbers the teacher read and the accept test judged are sound.
On the held-out benchmark it cost me everything. The extensions loaded on 3 of the 15 tasks. The one task that passed was one of the twelve where they did not load. Whatever produced that pass, it was not the harness, because the harness was not running.
So the honest result is not 1 of 15. It is that the generalization check never happened.
2. A task’s score can move by two trials for no reason
Those three tasks where the harness never loaded turned into the most useful accident in the run. Nothing changed for them across the whole experiment, so they are the same setup measured five separate times, six weeks apart.
Two of them scored 3 out of 3 every single time. The third scored 0, 1, 2, 1, and 2 out of 3. Same task, same model, same everything, swinging by two trials.
Another task, which the triage called easy and deterministic, scored 0, 3, 1, 0, 2 across the same five passes.
My headline result on the small split is two tasks moving by one trial each. That is smaller than the swing above. Any single-task change I report has to be read against this.
3. The baseline ran under a handicap
The baseline ran two tasks at the same time. Every run after it ran one at a time. I did not notice for a month.
Two tasks at once share one model server, so each gets roughly half the speed. Tasks are killed on a wall-clock timer. That means the baseline was racing the same clock at half the speed, on the exact measure the harness gets credit for improving.
The size of it: on the 34-task comparison, 25 of the baseline’s 102 trials ran out of time or context, against 19 of the final harness’s. Six trials cannot turn into six fixed tasks, so this does not explain the result away. It does make the result look better than it is, by an amount I cannot calculate, because the server settings were never recorded.
All three have the same shape. Each was a variable nobody thought to write down. The pipeline checks that the model settings never drift, records what harness ran inside every container, and verifies every command-line flag before launching. None of that caught any of these, because none of these were things it knew to look at.
14. So, does it work at 9B?
Yes. The harness makes the frozen 9B better at this benchmark. Three things stop that being a strong claim.
How big is it. Six tasks fixed, none broken, out of 34. Val pass@3 goes from .400 to .500, and the wider comparison from .441 to .618. For a frozen 9B on a desktop GPU that is worth having. But the sample is small, I picked the comparison after seeing the data, and the baseline ran under the handicap in section 13. Treat it as a signal worth another phase rather than a finished result.
Does it hold anywhere else. I do not know. The test I built to answer that did not run.
One test I still owe. Give the bare agent the same number of tokens and let it simply try the task several times. Does it do as well? If it does, the harness bought nothing and I only spent more compute. The final harness scored highest while using the fewest tokens of any version including bare, which points the right way, but I have not run that comparison and until I do the question is open.
What I am sure of. Control-logic middleware reaches a 9B and changes what it does. The blocks load, they fire, and sessions end differently because of them. Going in, my worry was that a small model would just ignore new scaffolding, which is the usual way these attempts fail. It did not ignore them.
What I got wrong was which problem to solve. I picked verification because it appeared in more traces than anything else I could act on. Verification middleware moved the verification rate by nothing. What worked was telling the model how much budget it had left, which it has no way of knowing on its own.
15. What’s next
- Fix the install path so the harness loads wherever the session starts, then re-run the held-out benchmark. Until that happens there is no generalization evidence in either direction.
- Re-run the bare agent on the 34-task comparison at matched concurrency, on the same days. About 102 trials and two days, and it removes the timing gap and the concurrency handicap at once.
- Measure the guard set’s variance on purpose rather than by accident, so a regression rule knows its own noise floor.
- Phase two, the tool layer, starting from the frozen final harness.
That last item may be in the wrong order. Section 12 suggested the harness reaches further but cannot hold a result steady, and holding a result steady looks more like a memory problem than a tools problem. If that is right, memory should come before tools. I will decide after the held-out benchmark runs, since that is the number most likely to change my mind.
The model-side track keeps running in parallel. I still owe a seventh training arm that picks random correct answers rather than the shortest ones, and a second seed on the results that surprised me the first time.
The numbers
701 scored trials across Terminal-Bench 2.0 and SkillsBench, totalling 319 hours of container wall time, of which 280 hours is the model actually working. Runs span 25 July to 29 August 2026, on top of the 89-trial baseline on 15 July, which adds roughly another 49 hours for about 370 hours in total across 790 trials. Phase A alone is 451 trials and 213 hours. That excludes a 135-trial run that launched and died, a 51-trial sweep I abandoned, and a 19-trial run that measured the wrong thing entirely.
Per-task figures and the extension-load counts were recomputed from raw trial artifacts rather than read from the run reports, since the problems in section 13 are invisible in the reports.
References
- Ren et al., Self-Improvements in Modern Agentic Systems: A Survey, arXiv:2607.13104. The decomposition this project is organised around.
- Agentic Harness Engineering, arXiv:2604.25850. Harness evolution on the same benchmark, frozen and transferred. The closest published precedent, done by hand rather than by a corrector loop.
- The model side of self-improvement: six toy runs. The other half of this pair.